Tests of RAID 6, 5, 1, and 0 Arrays with Hitachi SAS-2 Drives
Gone are the days when a decent professional 8-port RAID controller cost a lot of money. Today there are solutions for the Serial Attached SCSI (SAS) interface, which are very attractive both in price, functionality, and performance. One of them is this review.
LSI MegaRAID SAS 9260-8i Controller
We have previously written about the second generation SAS interface with a transfer rate of 6 Gb / s and the very cheap 8-port LSI SAS 9211-8i HBA controller designed for organizing storage systems of the entry price level based on the simplest SAS and SATA RAID arrays. drives. The LSI MegaRAID SAS 9260-8i model will be a higher class - it is equipped with a more powerful processor with hardware processing of arrays of levels 5, 6, 50 and 60 (ROC technology - RAID On Chip), as well as a tangible volume (512 MB) of onboard SDRAM memory for efficient data caching. This controller also supports 6Gb / s SAS and SATA interfaces, and the adapter itself is designed for the bus PCI Express x8 version 2.0 (5Gbps per lane), which is theoretically nearly enough to meet the needs of 8 high-speed SAS ports. And all this - at a retail price of about $ 500, that is, only a couple of hundred more expensive than the budget LSI SAS 9211-8i. The manufacturer himself, by the way, refers this solution to the MegaRAID Value Line series, that is, economical solutions.


8-port SAS controller LSIMegaRAID SAS9260-8i and its SAS2108 processor with DDR2 memory
LSI SAS 9260-8i board has a low profile (MD2 form factor), is equipped with two internal Mini-SAS 4X connectors (each of them allows you to connect up to 4 SAS disks directly or more through port multipliers), is designed for PCI Express x8 2.0 and supports RAID levels 0, 1, 5, 6, 10, 50 and 60, dynamic SAS functionality, and more. etc. The LSI SAS 9260-8i controller can be installed both in 1U and 2U rack servers (Mid and High-End servers), and in ATX and Slim-ATX cases (for workstations). RAID support is provided by hardware - built-in LSI SAS2108 processor (PowerPC core at 800 MHz), supplemented with 512 MB DDR2 800 MHz memory with ECC support. LSI promises processor speeds up to 2.8 GB / s reading and 1.8 GB / s writing. Among the rich functionality of the adapter, it is worth noting the functions Online Capacity Expansion (OCE), Online RAID Level Migration (RLM) (expanding the volume and changing the type of arrays on the go), SafeStore Encryption Services and Instant secure erase (encrypting data on disks and securely deleting data ), support for solid state drives (SSD Guard technology), and more. etc. A battery module is optionally available for this controller (with it the maximum operating temperature should not exceed +44.5 degrees Celsius).
LSI SAS 9260-8i Controller Key Specifications
| System interface | PCI Express x8 2.0 (5 GT / s), Bus Master DMA |
| Disk interface | SAS-2 6Gb / s (Supports SSP, SMP, STP, and SATA) |
| SAS ports | 8 (2 x4 Mini-SAS SFF8087 connectors), supports up to 128 drives via port multipliers |
| RAID support | levels 0, 1, 5, 6, 10, 50, 60 |
| CPU | LSI SAS2108 ROC (PowerPC @ 800 MHz) |
| Built-in cache memory | 512 MB ECC DDR2 800 MHz |
| Power consumption, no more | 24 W (power supply +3.3 V and +12 V from PCIe slot) |
| Operating / storage temperature range | 0 ... + 60 ° С / -45 ... + 105 ° С |
| Form factor, dimensions | MD2 low-profile, 168 x 64.4 mm |
| MTBF value | > 2 million h |
| Manufacturer's warranty | 3 years |
The manufacturer identified typical applications of the LSI MegaRAID SAS 9260-8i as follows: a variety of video stations (video on demand, video surveillance, video creation and editing, medical images), high performance computing and digital data archives, various servers (file, web, mail, databases). In general, the vast majority of tasks solved in small and medium-sized businesses.

In a white-orange box with a frivolously smiling toothy lady's face on the "title" (apparently, in order to better lure bearded sysadmins and harsh system builders) there is a controller board, brackets for its installation in ATX, Slim-ATX, etc., two 4-disk cables with Mini-SAS connectors on one end and regular SATA (no power) on the other (for connecting up to 8 drives to the controller), as well as a CD with PDF documentation and drivers for numerous versions of Windows, Linux (SuSE and RedHat), Solaris and VMware.

Scope of delivery for the boxed version of the LSI MegaRAID SAS 9260-8i controller (MegaRAID Advanced Services Hardware Key mini-card is available on request)
LSI MegaRAID Advanced Services software technologies are available with a special hardware key (supplied separately) for the LSI MegaRAID SAS 9260-8i controller: MegaRAID Recovery, MegaRAID CacheCade, MegaRAID FastPath, LSI SafeStore Encryption Services (beyond the scope of this article). In particular, in terms of increasing the performance of an array of traditional disks (HDD) with the help of a solid-state drive (SSD) added to the system, MegaRAID CacheCade technology will be useful, with the help of which the SSD acts as a second-level cache for the HDD array (analogous to a hybrid solution for HDD), in some cases, providing an increase in the performance of the disk subsystem up to 50 times. Of interest is also the MegaRAID FastPath solution, which reduces the latency of the SAS2108 processor processing I / O operations (by disabling optimization for hard disk drives), which allows you to speed up the operation of an array of several solid-state drives (SSD) connected directly to the SAS 9260-8i ports.
Operations for configuring, setting up and maintaining the controller and its arrays are more convenient to perform in the corporate manager in the operating system environment (settings in BIOS menu Setup of the controller itself is not rich enough - only basic functions are available). In particular, in the manager, in a few mouse clicks, you can organize any array and set the policies for its operation (caching, etc.) - see screenshots.


Sample screenshots of the Windows Manager for Configuring RAID Levels 5 (above) and 1 (below).
Testing
To get acquainted with the basic performance of the LSI MegaRAID SAS 9260-8i (without the MegaRAID Advanced Services Hardware Key and related technologies), we used five high-performance SAS drives with a spindle rotation speed of 15 thousand rpm and support for the SAS-2 interface (6 Gb / c) - Hitachi Ultrastar 15K600 HUS156030VLS600 with a capacity of 300 GB each.

Hitachi Ultrastar 15K600 hard drive without top cover
This will allow us to test all the basic levels of arrays - RAID 6, 5, 10, 0 and 1, and not only with the minimum number of disks for each of them, but also "for growth", that is, when adding a disk to the second of 4-channel SAS ports of the ROC chip. Note that the hero of this article has a simplified analogue - a 4-port LSI MegaRAID SAS 9260-4i controller based on the same element base. Therefore, our tests of 4-disk arrays are equally applicable to it.
The maximum sequential read / write speed of the payload for the Hitachi HUS156030VLS600 is about 200 MB / s (see graph). Average read access time (specs) - 5.4 ms. The built-in buffer is 64 MB.

Hitachi Ultrastar 15K600 HUS156030VLS600 sequential read / write speed graph
The test system was based on an Intel Xeon 3120 processor, a motherboard with an Intel P45 chipset, and 2GB of DDR2-800 memory. The SAS controller was installed in the PCI Express x16 v2.0 slot. The tests were carried out under the operating systems Windows XP SP3 Professional and Windows 7 Ultimate SP1 x86 (pure American versions), since their server counterparts (Windows 2003 and 2008, respectively) do not allow some of the benchmarks and scripts we used to work. The tests used were AIDA64, ATTO Disk Benchmark 2.46, Intel IOmeter 2006, Intel NAS Performance Toolkit 1.7.1, C'T H2BenchW 4.13 / 4.16, HD Tach RW 3.0.4.0 and for Futuremark PCMark Vantage and PCMark05. The tests were carried out on both unallocated volumes (IOmeter, H2BenchW, AIDA64) and formatted partitions. In the latter case (for NASPT and PCMark), the results were taken both for the physical beginning of the array and for its middle (volumes of arrays with the maximum available capacity were divided into two equal logical partitions). This allows us to more adequately assess the performance of solutions, since the fastest initial sections of volumes, on which file benchmarks are carried out by most browsers, often do not reflect the situation on the rest of the disk, which in real work can also be used very actively.
All tests were performed five times and the results were averaged. We will consider our updated methodology for evaluating professional disk solutions in more detail in a separate article.
It remains to add that in this testing we used controller firmware version 12.12.0-0036 and drivers version 4.32.0.32. Write and read caching has been enabled for all arrays and disks. Perhaps the use of more modern firmware and drivers saved us from the oddities noticed in the results of early tests of the same controller. In our case, no such incidents were observed. However, we also do not use the FC-Test 1.0 script, which is very doubtful in terms of the reliability of the results (which in certain cases the same colleagues "would like to call confusion, vacillation and unpredictability") in our package, because we have repeatedly noticed its inconsistency on some file patterns ( in particular, sets of many small, less than 100 Kbytes, files).
The diagrams below show the results for 8 array configurations:
- RAID 0 of 5 disks;
- RAID 0 of 4 disks;
- RAID 5 of 5 disks;
- 4-drive RAID 5;
- RAID 6 of 5 disks;
- RAID 6 of 4 disks;
- RAID 1 of 4 disks;
- RAID 1 of 2 disks.
LSI obviously understands a four-disk RAID 1 array (see screenshot above) as a strip + mirror array, usually referred to as RAID 10 (this is also confirmed by the test results).
Test results
In order not to overload the web page of the review with an innumerable set of diagrams, sometimes uninformative and tiring (which is often the fault of some "rabid colleagues" :)), we have summarized the detailed results of some tests in table... Those who wish to analyze the subtleties of the results we have obtained (for example, to find out the behavior of the persons involved in the most critical tasks for themselves) can do it on their own. We will focus on the most important and key test results, as well as on average indicators.
Let's take a look at the results of the "purely physical" tests first.
The average time of random access to data when reading on a single Hitachi Ultrastar 15K600 HUS156030VLS600 disk is 5.5 ms. However, when they are organized into arrays, this indicator changes slightly: it decreases (due to efficient caching in the LSI SAS9260 controller) for "mirrored" arrays and increases for all others. The largest increase (about 6%) is observed for arrays of level 6, since the controller has to simultaneously access the largest number of disks (three for RAID 6, two for RAID 5 and one for RAID 0, since the address in this test occurs in blocks of only 512 bytes, which is significantly less than the size of array interleaving blocks).
The situation with random access to arrays during writing (in blocks of 512 bytes) is much more interesting. For a single disk, this parameter is about 2.9 ms (without caching in the host controller), however, in the arrays on the LSI SAS9260 controller, we observe a significant decrease in this figure due to the good write caching in the 512 MB SDRAM buffer of the controller. Interestingly, the most dramatic effect is obtained for RAID 0 arrays (random write access time drops by almost an order of magnitude compared to a single drive)! This should undoubtedly have a beneficial effect on the performance of such arrays in a number of server tasks. At the same time, even on arrays with XOR calculations (that is, a high load on the SAS2108 processor), random write access does not lead to an obvious slowdown - again thanks to the powerful controller cache. It is natural that RAID 6 is slightly slower here than RAID 5, but the difference between them is, in fact, insignificant. I was somewhat surprised in this test by the behavior of a single "mirror", which showed the slowest random access when writing (perhaps this is a "feature" of the microcode of this controller).
The graphs of linear (sequential) read and write (in large blocks) for all arrays do not have any peculiarities (for reading and writing, they are almost identical, provided that controller write caching is enabled) and they all scale according to the number of disks participating in parallel in the "useful "Process. That is, for a five-disk RAID 0 disks, the speed “doubles” relative to a single disk (reaching 1 GB / s!), For a five-disk RAID 5 it “quadruples”, for RAID 6 it “triples” (triples, of course :)), for a RAID 1 of four disks, it doubles (no fuss! :)), and for a simple mirror, it duplicates the graphs of a single disk. This pattern is clearly visible, in particular, in terms of the maximum read and write speed of real large (256 MB) files in large blocks (from 256 KB to 2 MB), which we will illustrate with the diagram of the ATTO Disk Benchmark 2.46 test (the results of this test for Windows 7 and XP are almost identical).
Here, only the case of reading files on a RAID 6 array of 5 disks unexpectedly dropped out of the overall picture (the results were rechecked many times). However, for reading in blocks of 64 KB the speed given array gains its assigned 600 MB / s. So let's write off this fact as a "feature" of the current firmware. Note also that when writing real files, the speed is slightly higher due to caching in a large controller buffer, and the difference with reading is the more noticeable, the lower the real linear speed of the array.
As for the interface speed, usually measured in terms of buffer writing and reading (multiple calls to the same disk volume address), here we are forced to state that it turned out to be the same for almost all arrays due to the inclusion of the controller cache for these arrays (see . table). Thus, the recording rates for all participants in our test were approximately 2430 MB / s. notice, that PCI bus Express x8 2.0 theoretically gives a speed of 40 Gb / s or 5 GB / s, however, according to useful data, the theoretical limit is lower - 4 GB / s, which means that in our case the controller really worked according to version 2.0 of the PCIe bus. Thus, the 2.4 GB / s measured by us is obviously the real bandwidth of the controller's on-board memory (DDR2-800 memory with a 32-bit data bus, which can be seen from the configuration of ECC chips on the board, theoretically gives up to 3.2 GB / s). When reading arrays, caching is not as "comprehensive" as when writing, therefore, the speed of the "interface" measured in utilities, as a rule, is lower than the speed of reading the controller's cache memory (typical 2.1 GB / s for arrays of levels 5 and 6) , and in some cases it "drops" to the speed of reading the buffer themselves hard drives(about 400 MB / s for a single hard drive, see the graph above) multiplied by the number of "sequential" disks in the array (these are just cases of RAID 0 and 1 from our results).
Well, with the "physics" we in the first approximation figured out, it's time to move on to the "lyrics", that is, to the tests of "real" kids applications. By the way, it will be interesting to find out whether the performance of arrays scales when performing complex user tasks as linearly as it scales when reading and writing large files (see the diagram of the ATTO test just above). An inquisitive reader, I hope, has already been able to predict the answer to this question.
As a “salad” to our “lyrical” part of the meal, we will serve desktop disk tests from the PCMark Vantage and PCMark05 packages (for Windows 7 and XP, respectively), as well as a similar “track” test of applications from the H2BenchW 4.13 package from the authoritative German magazine C'T. Yes, these benchmarks were originally designed to evaluate hard drives in desktop PCs and low-cost workstations. They emulate the execution on disks of typical tasks of an advanced personal computer - working with video, audio, "photoshop", antivirus, games, a swap file, installing applications, copying and writing files, etc. Therefore, their results should not be taken in the context of this article. as the ultimate truth - after all, other tasks are often performed on multi-disk arrays. Nevertheless, in light of the fact that the manufacturer himself positions this RAID controller, including for relatively inexpensive solutions, this class of test tasks is quite capable of characterizing a certain proportion of applications that will actually be executed on such arrays (the same work with video, professional graphics processing, swapping OS and resource-intensive applications, copying files, anti-virus, etc.). Therefore, the importance of these three complex benchmarks in our overall package should not be underestimated.
In the popular PCMark Vantage, on average (see the diagram), we observe a very remarkable fact - the performance of this multi-disk solution is almost independent of the type of array used! By the way, within certain limits, this conclusion is also valid for all individual test tracks (types of tasks) included in the PCMark Vantage and PCMark05 packages (see the table for details). This can mean either that the firmware algorithms of the controller (with cache and disks) almost do not take into account the specifics of the operation of applications of this type, or the fact that the bulk of these tasks are performed in the cache memory of the controller itself (and most likely we observe a combination of these two factors ). However, for the latter case (that is, the execution of tracks to a large extent in the cache of the RAID controller) the average performance of the solutions turns out to be not that high - compare this data with the test results of some "desktop" ("chipset") 4-disk RAID 0 arrays and 5 and inexpensive single SSDs on the SATA 3Gb / s bus (see overview). If compared to a simple "chipset" 4-disk RAID 0 (and on twice slower hard drives than the Hitachi Ultrastar 15K600 used here) arrays on LSI SAS9260 are less than twice as fast in PCMark tests, then relatively not even the fastest "budget" single SSD they all definitely lose! The results of the PCMark05 disk test give a similar picture (see the table; there is no point in drawing a separate diagram for them).
A similar picture (with some reservations) for arrays on LSI SAS9260 can be observed in another "track" application benchmark - C'T H2BenchW 4.13. Here, only two of the slowest (in terms of structure) arrays (RAID 6 of 4 disks and a simple "mirror") noticeably lag behind all other arrays, the performance of which, obviously, reaches that "sufficient" level when it no longer rests on the disk subsystem, and in the efficiency of the SAS2108 processor with the controller's cache with these complex sequences of calls. And in this context, we can be pleased with the fact that the performance of arrays based on LSI SAS9260 in tasks of this class is almost independent of the type of array used (RAID 0, 5, 6 or 10), which allows using more reliable solutions without sacrificing the final performance.
However, "Maslenitsa is not all for the cat" - if we change the tests and check the operation of arrays with real files on the NTFS file system, the picture will change dramatically. Thus, in the Intel NASPT 1.7 test, many of the "pre-installed" scenarios of which are quite directly related to tasks typical for computers equipped with an LSI MegaRAID SAS9260-8i controller, the array disposition is similar to that which we observed in the ATTO test when reading and writing. large files - the performance increases proportionally as the "linear" speed of the arrays grows.
In this diagram, we show the average for all tests and NASPT patterns, while in the table you can see the detailed results. Let me emphasize that we ran NASPT both under Windows XP (this is what many browsers usually do) and under Windows 7 (which, due to certain peculiarities of this test, is done less often). The fact is that Seven (and its "big brother" Windows 2008 Server) use more aggressive native caching algorithms when working with files than XP. In addition, copying of large files in the "Seven" occurs mainly in blocks of 1 MB (XP, as a rule, operates in blocks of 64 KB). This leads to the fact that the results of the "file" test Intel NASPT significantly differ in Windows XP and Windows 7 - in the latter they are much higher, sometimes more than twice! By the way, we compared the results of NASPT (and other tests of our suite) under Windows 7 with 1 GB and 2 GB of installed system memory (there is information that with large amounts of system memory caching of disk operations in Windows 7 increases and NASPT results become even higher) , however, we did not find any difference within the measurement error.
Disputes about which OS (in terms of caching policies, etc.) is "better" to test disks and RAID controllers, we leave for the discussion thread of this article. We believe that testing drives and solutions based on them should be in conditions as close as possible to real situations of their operation. That is why, in our opinion, the results obtained by us for both OS are of equal value.
But back to the NASPT average performance chart. As you can see, the difference between the fastest and the slowest of the arrays we tested here averages a little less than three times. This, of course, is not a fivefold gap, as when reading and writing large files, but it is also quite noticeable. The arrays are actually located in proportion to their linear speed, and this is good news: this means that the LSI SAS2108 processor is fast enough to process data, almost without creating bottlenecks when arrays of levels 5 and 6 are actively working.
To be fair, it should be noted that there are patterns in NASPT (2 out of 12), in which the same picture is observed as in PCMark with H2BenchW, namely that the performance of all tested arrays is practically the same! These are Office Productivity and Dir Copy to NAS (see table). This is especially evident under Windows 7, although the tendency of "convergence" is evident for Windows XP (in comparison with other patterns). However, there are patterns in PCMark with H2BenchW where the performance of arrays grows in proportion to their linear speed. So everything is not as simple and unambiguous as some might like.
At first, I wanted to discuss a diagram with the overall performance of the arrays, averaged over all application tests (PCMark + H2BenchW + NASPT + ATTO), that is, this one:
However, there is nothing special to discuss here: we see that the behavior of arrays on the LSI SAS9260 controller in tests that emulate the operation of certain applications can radically differ depending on the scenarios used. Therefore, it is better to draw conclusions about the benefits of a particular configuration based on what tasks you are going to perform at the same time. And in this we can noticeably help another professional test - synthetic patterns for IOmeter, emulating one or another load on the data storage system.
Tests in IOmeter
In this case, we will skip the discussion of numerous patterns that carefully measure the speed of work depending on the size of the access block, the percentage of write operations, the percentage of random accesses, etc. This is, in fact, pure synthetics, which gives little useful practical information and is of interest rather purely theoretically. After all, we have already clarified the main practical points regarding "physics" above. It is more important for us to focus on patterns that emulate real work - servers of various types, as well as file operations.
To emulate servers such as File Server, Web Server and DataBase (database server), we used the well-known patterns of the same name, proposed at the time by Intel and StorageReview.com. For all cases, we tested the arrays with a command queue depth (QD) from 1 to 256 with a step of 2.
In the "Database" pattern, which uses random disk accesses in blocks of 8 KB within the entire array size, one can observe a significant advantage of arrays without parity control (that is, RAID 0 and 1) with a command queue depth of 4 and higher, while all arrays with parity (RAID 5 and 6) demonstrate very similar performance (despite the twofold difference between them in linear access speed). The situation can be easily explained: all parity-checked arrays showed similar values in tests for the average random access time (see the diagram above), and it is this parameter that mainly determines the performance in this test. It is interesting that the performance of all arrays grows almost linearly with increasing command queue depth up to 128, and only at QD = 256, in some cases, one can see a hint of saturation. The maximum performance of arrays with parity at QD = 256 was about 1100 IOps (operations per second), that is, the LSI SAS2108 processor spends less than 1 ms to process one piece of data in 8 KB (about 10 million single-byte XOR operations per second for RAID 6 ; of course, the processor simultaneously performs other tasks for data input-output and working with cache memory).
In the pattern of a file server that uses blocks of different sizes for random read and write accesses to an array within its entire volume, we observe a picture similar to DataBase, with the difference that here five-disk arrays with parity (RAID 5 and 6) noticeably outperform in speed. their 4-disk counterparts and demonstrate almost identical performance (about 1200 IOps at QD = 256)! Apparently, adding the fifth disk to the second of the two 4-channel SAS ports of the controller somehow optimizes the computational load on the processor (due to I / O operations?). It may be worth comparing the speed of 4-disk arrays, when the drives are connected in pairs to different Mini-SAS connectors of the controller, in order to determine the optimal configuration for organizing arrays on the LSI SAS9260, but this is already a task for another article.
In the web server pattern, where, according to its creators, there are no write operations to disk (and hence the calculation of XOR-functions for writing) as a class, the picture becomes even more interesting. The fact is that all three five-disk arrays from our set (RAID 0, 5 and 6) show identical performance here, despite the noticeable difference between them in terms of linear read speed and parity calculations! By the way, these same three arrays, but of 4 disks, are also identical in speed to each other! And only RAID 1 (and 10) falls out of the picture. Why this happens is difficult to judge. Perhaps the controller has very efficient algorithms for selecting "good drives" (that is, those of the five or four drives from which the necessary data comes first), which in the case of RAID 5 and 6 increases the likelihood of earlier data arrival from the platters, preparing the processor in advance for necessary calculations (remember the deep command queue and the large DDR2-800 buffer). As a result, this can compensate for the latency associated with XOR calculations and equalize them in "chances" with "simple" RAID 0. In any case, the LSI SAS9260 controller can only be praised for its extremely high results (about 1700 IOps for 5-disk arrays with QD = 256) in the Web Server pattern for arrays with parity. Unfortunately, the very low performance of the two-disk mirror in all these server patterns has become a fly in the ointment.
The Web Server pattern is echoed by our own pattern, which emulates random reading of small (64 KB) files within the entire array space.
Again, the results were combined into groups - all 5-disk arrays are identical to each other in speed and are leading in our "race", 4-disk RAID 0, 5 and 6 are also indistinguishable from each other in performance, and only "mirrors" fall out of the total mass (by the way, 4-disk "mirror", that is, RAID 10 is faster than all other 4-disk arrays - apparently due to the same algorithm of "choosing a successful disk"). We emphasize that these regularities are valid only for a large depth of the command queue, while with a small queue (QD = 1-2), the situation and leaders can be completely different.
Everything changes when servers work with large files. In the conditions of modern "heavy" content and new "optimized" OS Windows type 7, 2008 Server etc. working with megabyte files and 1MB data blocks is becoming increasingly important. In this situation, our new pattern, emulating random reading of 1 MB files within the entire disk (details of new patterns will be described in a separate article on the methodology), turns out to be very useful in order to more fully assess the server potential of the LSI SAS9260 controller.
As you can see, the 4-disk "mirror" here leaves no one hopes for leadership, clearly dominating at any queue of commands. Its performance also initially grows linearly with increasing command queue depth, but at QD = 16 for RAID 1, it reaches saturation (speed is about 200 MB / s). A little “later” (at QD = 32) performance saturation occurs in the arrays that are slower in this test, among which “silver” and “bronze” have to be given to RAID 0, and arrays with parity are outsiders, having lost even before shining RAID 1 of two disks, which turns out to be surprisingly good. This leads us to the conclusion that even when reading, the computational XOR load on the LSI SAS2108 processor when working with large files and blocks (located at random) is very burdensome for it, and for RAID 6, where it actually doubles, it is sometimes even exorbitant - the performance of solutions barely exceeds 100 MB / s, that is, 6-8 times lower than with linear reading! Redundant RAID 10 is clearly more profitable here.
When randomly recording small files, the picture is again strikingly different from those that we saw earlier.
The fact is that here the performance of arrays practically does not depend on the depth of the command queue (obviously, the huge cache of the LSI SAS9260 controller and rather large caches of the hard drives themselves affect), but it changes dramatically with the type of the array! The unconditional leaders here are "unpretentious" for the processor RAID 0, and "bronze" with a more than two-fold loss to the leader - in RAID 10. All arrays with parity formed a very close single group with a two-disk mirror (details on them are given in a separate diagram under the main ), losing three times to the leaders. Yes, this is definitely a heavy load on the controller processor. However, frankly speaking, I did not expect such a "failure" from SAS2108. Sometimes even a software RAID 5 based on a "chipset" SATA controller (with caching by means of Windows and calculation with the help of a PC's central processor) is able to work faster ... the chart for the average write access time at the beginning of the results section.
The transition to random writing of large files of 1 MB leads to an increase in absolute speed indicators (for RAID 0 - almost to values for random reading of such files, that is, 180-190 MB / s), but the overall picture remains almost unchanged - arrays with parity many times slower than RAID 0.
The picture for RAID 10 is curious - its performance drops with increasing command queue depth, although not much. There is no such effect for the rest of the arrays. The two-disk "mirror" looks modest here again.
Now let's look at patterns in which files in equal amounts are read and written to disk. Such loads are typical, in particular, for some video servers or during active copying / duplication / backup of files within the same array, as well as in the case of defragmentation.
First - files of 64 KB randomly throughout the array.
Here, some similarity with the results of the DataBase pattern is obvious, although the absolute speeds of the arrays are three times higher, and even with QD = 256, some performance saturation is already noticeable. The higher (in comparison with the DataBase pattern) percentage of write operations in this case leads to the fact that arrays with parity and a two-disk "mirror" become obvious outsiders, significantly inferior in speed to arrays of RAID 0 and 10.
When switching to 1 MB files, this pattern is generally preserved, although the absolute speeds approximately triple, and RAID 10 becomes as fast as a 4-disk stripe, which is good news.
The last pattern in this article will be the case of sequential (as opposed to random) reading and writing of large files.
And here already many arrays manage to overclock to very decent speeds in the region of 300 MB / s. And although more than a twofold gap between the leader (RAID 0) and the outsider (two-disk RAID 1) remains (note that with linear reading OR writing, this gap is fivefold!) may not be encouraging. Indeed, judging by the list of applications of this controller, which LSI itself provides (see the beginning of the article), many target tasks will use this particular nature of accessing arrays. And this is definitely worth considering.
In conclusion, I will give a final diagram, in which the indicators of all the above IOmeter test patterns are averaged (geometrically over all patterns and command queues, without weights). It is curious that if the averaging of these results within each pattern is carried out arithmetically with weight coefficients 0.8, 0.6, 0.4, and 0.2 for command queues 32, 64, 128, and 256, respectively (which conditionally takes into account the drop in the share of operations with a high the depth of the command queue in common work drives), then the final (for all patterns) normalized array performance index within 1% coincides with the geometric mean.
So, the average "temperature in the hospital" in our patterns for the IOmeter test shows that there is no way to get away from "physics with mathematics" - RAID 0 and 10 are definitely in the lead. For arrays with parity, miracles did not happen - although the LSI SAS2108 processor in some cases, decent performance, in general, cannot "hold out" such arrays to the level of a simple "stripe". At the same time, it is interesting that 5-disk configurations clearly increase in comparison with 4-disk ones. In particular, 5-disk RAID 6 is definitely faster than 4-disk RAID 5, although in terms of "physics" (random access time and linear access speed) they are virtually identical. The two-disk "mirror" was also disappointing (on average, it is equivalent to a 4-disk RAID 6, although two XOR calculations for each bit of data are not required for a mirror). However, a simple "mirror" is obviously not the target array for a sufficiently powerful 8-port SAS controller with a large cache and a powerful onboard processor. :)
Price information
The LSI MegaRAID SAS 9260-8i 8-port SAS controller with a complete package is priced in the region of $ 500, which can be considered quite attractive. Its simplified 4-port counterpart is even cheaper. A more accurate current average retail price of the device in Moscow, relevant at the time of your reading this article:
| LSI SAS 9260-8i | LSI SAS 9260-4i |
|---|---|
| $571() | $386() |
Conclusion
Summarizing the above, we can conclude that we will not dare to give uniform recommendations "for everyone" on the 8-port LSI MegaRAID SAS9260-8i controller. Everyone should draw conclusions on their own about the need to use it and configure certain arrays with its help - strictly based on the class of tasks that are supposed to be launched at the same time. The fact is that in some cases (on some tasks) this inexpensive "megamonster" is able to show outstanding performance even on arrays with double parity (RAID 6 and 60), but in other situations the speed of its RAID 5 and 6 clearly leaves much to be desired. ... And the salvation (almost universal) will be only a RAID 10 array, which can be organized with almost the same success on cheaper controllers. However, it is often thanks to the SAS9260-8i processor and cache that the RAID 10 array behaves here no slower than a stripe from the same number of disks, while ensuring high reliability of the solution. But what should definitely be avoided with the SAS9260-8i is a two-disk DSLR and 4-disk RAID 6 and 5 - these are obviously sub-optimal configurations for this controller.
Thanks to Hitachi Global Storage Technologies
for the hard drives provided for testing.
High-performance 6Gb / s hardware RAID controller 9260-8i with 8 internal ports (2 SFF8087 connectors) and 512MB of on-board memory, supporting up to 128 SAS and SATA drives with RAID-on-Chip technology.
The high-performance MegaRAID SATA + SAS 9260 product line delivers blistering data transfer rates of up to 2880MB / s read, 1850MB / s write, and 147,000 random access I / O to support even the most demanding applications such as like databases and video processing.
These products enable 3 Gb / s and 6 Gb / s media with support for internal connection both SATA and SAS drives.
Internal connection of SATA or SAS drives of the server. Allows you to work with 128 devices using SAS expanders. LSI RAID-on-Chip (ROC) technology and primary PCI Express interface for high bandwidth applications.
Optional backup battery to prevent data loss in the event of server failure.
Supports additional CacheCade, FastPath and Recovery / Snapshots software.
Key Features
- Maximum available performance level: read mode: 2.875MB / s, write mode: 1.850MB / s
- PCI Express 2.0 provides faster signal transfer rates for high bandwidth applications
- Maximum flexibility with support for 3Gb / s and 6Gb / s SATA and SAS drives
- SafeStore Encryption technology provides stronger data protection
- Low profile MD2 design suitable for compact 1U and 2U architectures
Specifications
| Parameter | Description |
| CPU | LSISAS2108 RAID-on-Chip (ROC) 800MHz PowerPC® |
| Performance | Up to 6Gbps per port |
| Interfaces | Eight internal SATA + SAS ports |
| Memory | Cache - 512MB DDRII (800MHz) |
| # Of Devices Supported | up to 32 SATA and / or SAS disk drives |
| Supported RAID levels | RAID - Level 0, 1, 5, and 6 Extended RAID 10, 50 and 60 |
| Host controller interface | X8 PCI Express v2.0 |
| Form Factor | Low profile MD2 format (167.64 mm x 64.42 mm) |
| Functionality | Emergency power supply unit (option, direct connection) Auto resume after upgrade Auto resume after recovery Online Capacity Expansion (OCE) Online RAID Level Migration (RLM) SafeStore data encryption system Immediate data deletion function SSD support with SSD Guard ™ technology Global and dedicated backups, emergency hot backups with data recovery Automatic recovery Structural Integrity for Hot Standby SATA emergency hot spare for SAS arrays Multi-channel support structure for one controller (failover) Load distribution Comprehensive RAID Management Software |
Dear customers.
Please note that the reference information on the goods posted on this site is not an offer, the availability and cost of equipment should be checked with the managers of NAG LLC, who will be happy to help you in choosing equipment and placing an order for it.
The manufacturer reserves the right to change the appearance, specifications and equipment without notice.
Approximately two years have passed since the announcement of the 9260 series controllers, excluding models with the “CV” prefix. During this time, in the Russian-language part of the Internet, our colleagues in IT journalism published several reviews describing the advantages of this series, and many tests were carried out. In order not to repeat the entire path of our colleagues, we decided to reveal the meaning of the abbreviation “CV” in the controllers of the updated series. Therefore, we carried out the tests in order to reveal the difference between the controllers already familiar to the market and the updated ones with the “CV” marking. Of course, we still have to go through the same steps as our colleagues, namely to remove the results of the tests of the RAID levels. But we hope that the comparative analysis of the results of the controller's operation with the “Cache Cade” will be appreciated by our readers. But first things first.

Controller specifications
Let's start by looking at the hardware of the controller, its most important characteristics and capabilities, functionality that it carries "on board" and which is provided by additional software.
The main hardware and software characteristics are shown in the table
|
LSI MegaRAID SAS 9260CV-8i |
|
|---|---|
| Solution | Eight-port internal SATA + SAS controllers for I / O-intensive applications. Wide bandwidth, SAS, SATA or SSD connectivity. Reduced maintenance and total cost of ownership with CacheVault technology |
| Dimensions (edit) | Low profile MD2 format (6.6 "X 2.536") |
| Connectors | Two internal Mini-SAS SFF-8087 connectors |
| Device support | Up to 128 SAS and / or SATA hard drives and solid state drives |
| Main processor bus type | PCI Express x8 version 2.0 |
| Baud rate | Up to 6 Gbps (per port) |
| SAS controller I / O processor | LSISAS2108 with RAID on Chip (ROC) |
| Cache size | 512 MB DDRII SDRAM |
| Cache protection | MegaRAID CacheVault Flash Cache Protection |
| Key Features of RAID Data Protection |
|
| RAID management |
|
| Optional SSD optimization |
MegaRAID CacheCade Software Increases I / O Performance by Using Solid State Drive as Cache |
The 9260CV-8i controller belongs to the Value Line series (a series of available solutions). This model differs from the more expensive Feature Line controllers by the presence of CacheVault (NAND Flash memory) "on board" the controller and the use of supercapacitors instead of the usual lithium-ion backup batteries (BBU). Unlike the Entry series, the 9260CV-8i uses the more powerful LSISAS2108 800 MHz processor with PowerPC architecture.

The types of supported RAID levels have not changed. The same familiar RAID types and their modifications are declared: 0, 00, 1, 10, 5, 50, 6 and 60.
As we mentioned above, supercapacitors have taken the place of the usual BBU backup battery, which became part of the new cache protection (Cache Vault). The basic principle of operation of the Cache Vault is almost identical to the use of the BBU. The supercapacitor maintains power to the cache. But, if in the case of a classic BBU with lithium-ion cells, the information in the controller's RAM is stored for about 72 hours, after which the data disappears, then the supercapacitor, in addition to maintaining it in the cache, allows recording information from cache to the NAND flash module located on the controller. When the power is restored, the information from the NAND will again be written to the controller cache. According to LSI (LSI MegaRaid CacheVault Technology), information in NAND can be stored for about three years.

Software
The most convenient way to manage and configure the controller is through MegaRAID Storage Manager. There is also the so-called WebBIOS - controller BIOS, called upon initialization during server boot, as well as command line(CLI).


For some money, the functions of the controller can be significantly expanded. V additional functionality includes the following proprietary LSI technologies.
MegaRAID FastPath
Allows you to optimize the performance of SSD drives connected to the controller and increase the number of I / O operations for transactional applications. LSI claims a 3x performance improvement, up to 150,000 IOPS, with MegaRAID FastPath.
MegaRAID CacheCade
A function by which an SSD is used as a cache for an array of hard drives, which can improve performance in web-based applications, databases, and real-time transaction processing (OLTP) by about 50 times


MegaRAID Recovery
Using snapshot technology, this feature allows you to create block-level images of the system. It is possible to restore both individual folders and files, and early states of the system as a whole.

MegaRAID SafeStore
Together with the self-encrypting drives (SED) encryption system built into the drives, it provides a high level of security against unauthorized access and attempts to change data.
There are two options for activating the listed functions. The first is to use a hardware key, that is, a microcircuit that is installed directly on the controller. The second is input software key via the RAIDweb console, or via the MegaRAID Storage Manager snap-in installed directly into the operating system. The options are equivalent in terms of the result, and the user can choose the most convenient way to activate the functions.


Testing methodology
Our methodology is based on our own many years of experience with server software. But, as is usually the case, there is some subjectivity. Therefore, we are ready to hone the methodology together with the readers. Leave your wishes at the end of the article.
We used the Windows 2008 R2 platform and used the IOMeter utility version 2006.07.27 to evaluate the I / O subsystem.
In testing, we used the Asustek RS720-E6 server. The configuration is shown in the table below.
| Asustek RS720-E6 Test Server Configuration | |
|---|---|
| Component | Specifications |
| Motherboard | ASUS Z8PE-D18 |
| Microprocessor | 2 х Intel Xeon E5620 (Westmere-EP), 2.40 GHz, 12 MB cache |
| RAM | 12 х Samsung DIMM DDR3-1333 4 GB PC3-10600 ECC Registered M393B5273BH1-CH9 |
| Hard drives | 7 х Hitachi Ultrastar 15K600 SAS-2.0 600 GB 15000 rpm 64 MB HUS156060VLS600 |
| Solid state drive | Intel SSD 510 250 GB |
We assigned one of the seven disks for the operating system. The server case we use supports 12 drives, but since its backplane does not contain an expander, and the controller is connected via ordinary 7-pin SATA cables, we used only 7 drives. We also used one footprint for the SSD under the CacheCade.
For testing, we used ready-made templates in IOmeter, namely WebServer, DataBase, FileServer, WorkStation. We also used sequential and random read / write templates with data blocks of various sizes - from 512 bytes to 1 MB with a step twice the previous block. The command queue depth was chosen equal to 30, which made it possible to load the disk subsystem. Large command queue depths are typical for corporate environments where the disk subsystem is under heavy load. This load can be virtual machines and terminal servers. As you can see from the characteristics of our platform, it is just designed for the corporate sector. Empirically, it was revealed that 30 commands is the lower limit from which the increased load on the disk subsystem begins. All RAID levels and their modifications supported by the controller were tested, with and without Cache Cade: 0, 00, 1, 10, 5, 50, 6. The only exception was level 60, since the absence of an expander did not allow installing eight disks.
The first stage tested the I / O performance of 14 configurations. The list is presented in the table.
| Test RAID configurations | |
|---|---|
| RAID-00 | 4 discs |
| RAID-00 + CacheCade | 4 discs |
| RAID-0 | 5 discs |
| RAID-0 + CacheCade | 5 discs |
| RAID-1R | 4 discs |
| RAID-1 + CacheCade | 4 discs |
| RAID-5 | 5 discs |
| RAID-5 + Cache Cade | 5 discs |
| RAID-6 | 5 discs |
| RAID-6 + CacheCade | 5 discs |
| RAID-10 | 4 discs |
| RAID-10 + CacheCade | 4 discs |
| RAID-50 | 6 discs |
| RAID-50 + CacheCade | 6 discs |
RAID-1 of four drives is similar to RAID10, which is confirmed by tests.
At the second stage, we made several measurements with virtual machinesb, for which we deployed the Hyper-V role and launched 4 virtual machines with Windows 7 at the same time. Each virtual machine corresponded to one IOmeter pattern: two web servers, for example, corporate (internal) and external, server databases and file server. Thus, it is possible to trace the operation of the device in a real scenario. It was decided to check the operation of this test with the most popular array configuration in practice - RAID5. CacheCade was involved.
Test results
Detailed figures for all charts can be found in.

DataBase Template Without CacheCade (CC)

FileServer Template without CacheCade (CC)

WorkStation Template Without Using CacheCade (CC)

WebServer Template Without Using CacheCade (CC)
In the first three graphs, the leading positions are taken by RAID-0 and RAID-50. RAID-50 outperforms RAID-10. On the graph of the results of work with the WebServer template, RAID-50 is already in the lead, and all the others are following it. The reason for leaving RAID-50 in the leadership in the number of disks - one more than other RAID levels, except for RAID-6. Second, in a web template, blocks of data are only read, even though the read is arbitrary. RAID-6 in all templates, except WebServer, is generally difficult, since the controller needs to calculate checksum for two disks.
Let's consider the same templates only using CacheCade:
The test is designed to show performance gains or lack thereof in I / O operations.

DataBase Template Using CacheCade (CC)

FileServer Template Using CacheCade (CC)

WorkStation Template Using CacheCade (CC)

WebServer Template Using CacheCade (CC)
When comparing the results, it can be noted that the graphs are almost identical, but a slight increase in the number of operations on some types of RAID arrays is still present, but it is so small that it can be neglected in almost all the results.
It is also worth noting that for some RAID levels the results with CacheCade turned out to be, albeit insignificantly, less than without it. This is especially evident in the FileServer template, at RAID levels 00, 5, 6, and 10. The decrease was least of all seen in the WebServer template - only in RAID5 the result was noticeably lower than that obtained without Cache Cade. It is difficult to say what exactly this decrease can be associated with. It can be assumed that this is due to 20% of the write operations specified in the template settings.
Now let's see how additional cache is in the form SSD disk will give an increase in sequential read and write speed. It is quite possible that it may seem superfluous, since the speed characteristics of RAID arrays are at least comparable to those of single SSD disks. Be that as it may, the tests will show.

Sequential read, megabytes per second, without using CacheCade
The graph shows that the first place is occupied by RAID 0, which is logical, since reading is performed in parallel from several disks, on 5 disks the speed at its peak reaches 930 megabytes per second. It is almost followed by three arrays practically on a level basis: RAID5, RAID00 and RAID50, which gave a drawdown on 16 KB blocks. RAID1 and RAID10 show identical results, since, as mentioned above, they are essentially identical and reveal their potential in this test on 512 KB blocks. RAID6 shows an even result starting from 4KB blocks.

Sequential read, megabytes per second, using CacheCade
The variant in which the Cache Cade is used gives almost identical results, with the only difference that the drop in speed at 16 KB blocks in the case of RAID50 is more dramatic. It is known that the read speed depends on the size of the stripe - a contiguous sequence of disk blocks. It is possible that this failure was influenced by its size, which by default for controllers is set to 64 KB, and which remained unchanged during all tests. It is possible that the fall could be caused by the controller firmware working with this block at this RAID level. We will try to find out what is the reason for this behavior of the controller from the LSI engineers.

Sequential write, megabytes per second, without using CacheCade
When writing, the load on the disks increases, respectively, the write speed will be lower in comparison with reading. The results are more stable - there are no such failures as in reading. With an increase in the block of recorded data up to 4-16 kbytes, the write speed increases, then it practically does not change.

Sequential write, megabytes per second, using CacheCade
Again, the results are very similar. For some blocks in this test, the difference was literally 100 KB / s, and not in favor of CacheCade. But this difference, again, can be neglected. The only RAID levels that have benefited from the cache are RAID1 and RAID5. Write speed in the case of RAID1 increased by 100 MB / s in the case of 2 kB blocks, and in RAID5 - 50 MB / s in 8 kB blocks.

Random read, megabytes per second, without using CacheCade
Random reading is not strong, but still divided the RAID arrays into three different groups based on the results obtained. This is noticeable on large blocks. The first group has RAID1 and RAID10, the second group has RAID0 and RAID00, and the third group has RAID5, RAID50 and RAID6. During reading, the arrays are not subject to the restrictions in the case of writing - checksum deduction (RAID5, 50 and 6) and information duplication (RAID1 and RAID10). The leaders here are RAID1 and RAID10, as they have fewer disks compared to other RAID levels.

Random read, megabytes per second, using CacheCade
The graph is similar to the previous one, with the only difference that the Cache Сade technology slightly increased the speed of work with 256 KB and 512 KB blocks for RAID1 and RAID10.

Random write, megabytes per second, without using CacheCade
The entry makes its own adjustments. Compared to the previous graphs, the speed dropped by about 50 MB / s. In addition to the fact that the heads are forced to "run" across the disk in search of data in a chaotic manner, introducing delays, the parameters of the RAID arrays also have an impact, which ensure their reliability (checksums and duplication).

Random write, megabytes per second using CacheCade
Again, the variation is minimal. In random write patterns, SSD cache tries to increase the performance of the disk subsystem, but it runs into difficulties. Despite the high performance of SSD in random write, everything depends on the calculation of additional checksums (RAID5, 50 and 6), duplication of information (RAID1, 10) and the number of disks (RAID0, 00) - SSD will not help in performing these overhead tasks.
Now let's turn to the results of measurements of the number of I / O operations.

Sequential read, operations per second, without using CacheCade

Sequential reads, operations per second, using CacheCade

Sequential Write, Operations Per Second, No CacheCade

Sequential write, operations per second, using CacheCade
The graphs show that CacheCade unleashes its full potential when working with sequential I / O operations. The difference between tests with and without CacheCade for some data blocks is over 100,000 operations per second. For example, for RAID5, if read, that's 275,000 IOPS with CacheCade versus 167,000 IOPS without cache. But this is not true for all RAID levels, for example, for RAID0, RAID10, RAID6, you can notice the difference not in favor of CacheCade. Why is this happening, we find it difficult to answer. We will ask the question to the LSI specialists and, having received the answer, we will add clarifications to the article.

Random read, operations per second, without using CacheCade

Random read, operations per second, using CacheCade

Random write, operations per second, without using CacheCade

Random write, operations per second, using CacheCade
Arbitrary operations do not benefit from using CacheCade.
Virtual machine tests
Results for one virtual machine


Results for four working simultaneously virtual machines.


In general, our idea of testing virtual machines belongs to the category "why not try it?" We tried to look at the operation of the controller in practical conditions, close to "combat".
We were not surprised by the virtual machine test results. The only difference that caught my eye was the slightly better results in the out-of-the-box templates (DataBase, FileServer, and WebSer). Perhaps the reason lies in the peculiarities of the operation of the virtual machine with the disk subsystem. When working directly with the disk subsystem, an unallocated array (Raw) was passed to the IOmeter testing utility. In the case of working with a virtual machine, the array was first formatted (cluster size 4 KB), then a pool was allocated for each virtual machine by creating a 100 GB * .VHD file, which acted as a disk for the virtual machine. It can be assumed that this somehow allowed to increase the results in standard templates.
However, when running four virtual machines at the same time, the results, as expected, dropped by about four times. We chose the number of virtual machines for a reason - four virtual machines appeared in the recommendations from VmWare and Microsoft employees.
Conclusion
According to the test results, we were convinced that the CacheCade technology works, with some reservations, but it performs its functions. The test results we got are slightly higher than those that exist on the network for the 9260-8i controller. This is not related to the peculiarity of the controller instance, which we got, since it does not differ from its brother in anything other than Cache Vault - neither in memory speed, nor processor characteristics, nor other parameters. Rather, the role was played by the productive components that we used: a new platform, fast disks(15,000 rpm) with a SAS2 interface and, of course, the CacheCade function, although the controller gives good results even without the help of an SSD.
Professional and semi-professional RAID controllers have changed dramatically since the transition of SCSI to serial rails. The parallel SCSI interface provides up to 320 MB / s bandwidth, which is shared among all devices connected to the bus using an expensive and capricious cable. Serial Attached SCSI (SAS), in contrast, supports 300 MB / s per port, multi-link or single-link cables, redundant links, external and internal devices... The controllers are also compatible with the SATA interface, that is, you can use both capacious SATA drives and high-performance SAS hard drives. Finally, the transition from PCI-X to PCI Express is in full swing. We believe it is time to look at four RAID controllers for entry-level servers.
Many users are still wondering whether to buy a separate RAID controller, given the powerful integrated SATA solutions such as Intel ICH9R found in many high-end motherboards such as the Asus P5K-WS (P35 chipset with PCI- X) or P5K64-WS (four PCI Express slots). Since manufacturers equip their top models with high quality voltage regulators and better components, the difference in quality between a high-end desktop motherboard and a low-end server product is only in the feature set. With six SATA / 300 ports on such a motherboard, advanced RAID management, and a dual- or quad-core processor that handles RAID 5 redundancy information, why buy an expensive external RAID controller?
Integrated solutions like these are likely to work well for a small workgroup server where the array is required to store project data, user information, and applications, but as the load increases, the constraints will manifest very quickly. If you require more sophisticated RAID levels such as RAID 50 or 60, built-in solutions will be of little use. Or, say, if you suddenly need to connect more than six hard drives, you will have to switch to another controller. And if you need to run the array in external hardware, or you want to get the full range of hard disk management functions, then SAS, legacy SCSI solutions or other vendor proprietary technologies are the only options.
We definitely do not recommend manufacturers' proprietary technologies that limit the choice of controller and accessories. All the necessary information about Serial Attached SCSI is given in the article SAS hard drive and controller benchmarks: SCSI days are numbered, including interface parts, cables, expansion options, accessories, hard drives, host adapters, etc. The latest generation SAS hard drives will provide much better performance than SATA models, but SATA compatibility and flexibility is a good reason to use a unified RAID controller in your system.

Can you tell? The top connector is SATA, and the bottom one belongs to the Seagate Savvio SAS drive.
SAS and SATA connections are full-duplex, point-to-point switched, so there is no longer any need to assign an ID to each device or terminate the bus. Connection data can be transmitted and received simultaneously. SAS and SATA are hot-pluggable. Acceleration of parallel protocols such as Ultra320 SCSI required either widening the bus, resulting in more wires, or higher clock speeds, but there were signal latency issues. And point-to-point serial connections can simply be shared. Actually, in SAS, this principle is just used when several SAS connections are combined together to connect external accessories.
There is only one mechanical difference between SAS and SATA: both interfaces use the same layout for data and power, but SATA has two physically separate connectors. For SAS, both connectors are connected, that is, you can connect a SATA hard drive to a SAS controller, but you cannot connect a SAS drive to a SATA controller via the SATA connector (SFF 8482). The operation of SATA hard drives on a SAS controller is possible due to the fact that the Serial ATA protocol is less complex and is simply tunneled into SAS during transmission. Thanks to the wide unified SAS connectors, the physical connection is very reliable, so the connectors cannot accidentally fall out. The main reason for the slight difference in the two connectors is the extended feature set of SAS, which you will not find in SATA controllers: SAS supports two-port connections, providing redundant hard drive connections (a necessary option for high-end storage) and supports so-called expanders (expanders) to expand storage devices, much like a network switch works with multiple clients.
When it comes to performance, there is little difference between the two interfaces. Serial ATA 2.5 provides a maximum throughput of 3 Gb / s per port with 8/10 bit encoding, giving 2.4 Gb / s or 300 MB / s per port for data transfer. The same applies to SAS, although the plans include 6 and 12 Gbps interfaces, which will give 600 and 1200 MB / s throughput per port.

SAS on the left, SATA on the right.

For grouping of SAS ports (usually four), a Mini SAS 4i connector (SFF-8087) is used.
Winchester trends: the onset of 2.5 "models
The main reason 3.5 "drives continue to dominate the professional arena is physical dimensions that match wide SCSI cables perfectly. However, the smaller 2.5" form factor is much more attractive because it combines high spindle speeds with less stress. into components due to the smaller diameter of the rotating plates. But complex SCSI interfaces and could not penetrate the 2.5 "world. The SAS interface changed the situation: the SFF 8484 connector allows you to connect 2.5" or 3.5 "drives, via SAS or SATA protocols. 2.5" form factor is more attractive for high-performance storage because you can increase the density of the drives, increasing throughput and I / O operations per second. At the same time, 2.5 "drives consume significantly less power than 3.5" models. Power consumption is becoming a serious problem in professional environments and data centers, where dozens, hundreds or even thousands of hard drives are used, and they require not only power, but also cooling, which also requires a lot of energy. From here it is quite clear that the driving force behind the 2.5 "form factor is price.

Seagate's Savvio line was the first commercially successful 2.5 "enterprise drive. Savvio 10K.2 replaces the first 10K.1 models, and Savvio 15K.1 drives are some of the highest performing SAS models on the market. to get eight Savvio 15K.1 hard drives on time, so we opted for eight Savvio 10K.2 models. Today, 73GB and 146GB options are available. We chose the smaller size so that our tests could be run in a reasonable amount of time. The drives are equipped with 16MB cache. use one 2.5 "platter and 3Gb / s SAS interface. Like other enterprise-grade drives, they come with a five-year warranty.
How about 3.5 "models?
They won't die, but 3.5 "SAS drives will be phased out of the corporate high-performance sector, giving way to 2.5" models. Considering the high capacity, the 7,200 rpm SATA models remain the best compromise between performance and capacity, they have already reached a capacity of 1 TB per HDD while the SAS and SCSI models at 10,000 rpm are still holding at 300 GB. To meet the needs of enterprise storage, all major hard drive manufacturers offer 24/7 validated SATA drives with a five-year warranty. Good examples include Seagate Barracuda ES, Hitachi UltraStar A7K1000 or E7K500, and Western Digital RAID Edition (RE).

Firmware: 5.2.0 Build 12415.
The first RAID controller in our testing is the Adaptec RAID 3805. This company differentiates between entry-level products and performance solutions, but the numbering of this model is somewhat self-explanatory. Each product that starts with a "3", as in this case, is a unified SAS / SATA model with 3Gb / s bandwidth per port. The second digit indicates the available number of ports, that is, four for RAID 3405, eight for RAID 3805, or 16 for RAID 31605. If the number of drives is preceded by "0", then the controller supports external accessories. The last digit can be "0" or "5", where "0" stands for host support for RAID, and "5" stands for hardware acceleration of RAID 5 and RAID 6. All unified controllers use PCI Express, so PCI-X models remain in past. By the way, you shouldn't confuse RAID 3805 and RAID 3085, where the latter is an external card with a faster IOP processor.
RAID 3805 is a modern model with eight SAS ports and hardware RAID acceleration for the PCI Express interface. The product is positioned at the entry / middle level and can be used on a wide range of operating systems, including all versions of Windows starting from Windows 2000, as well as Red Hat and SuSe Linux, Novell Netware, SCO Open Server, Sun Solaris, FreeBSD, UnixWare and VMware ESX Server ... The controller for calculating XOR operations uses Intel processor 80333 at 500 MHz and equipped with 128 MB DDR2 memory with ECC. Featuring a low-profile form factor and two SFF 8487 connectors, each providing four ports with one physical connection, RAID 3805 can be installed in compact 1U servers that have a x4 PCI Express slot.
Adaptec supports RAID 0, 1, 1E (similar to RAID 10), 5, 5EE (with hot spare), 6, 10, 50, 60, and JBOD, giving administrators some flexibility. In terms of features, the list is long, including all the usual RAID features - online capacity expansion, RAID level migration, fast / background initialization, native command queue (NCQ) support, different modes indication of spare / spare disks (global / dedicated / pooled), work with snap-ins via SCSI-accessed Fault-Tolerant Enclosure (SAFTE), delayed spindle spin-up time, etc. Among the curious functions, we note the so-called "copyback hot spare", which, after replacing a failed hard drive, turns the new hard drive into the old one. So you don't have to change the disk labels in the snap-in. In the table below, we have compared the functions of the three controllers.
The package includes a controller, a low profile slot cover, a quick installation guide in multiple languages, a software CD, and two SFF 8487 and SFF 8484 Mini SAS to SATA / SAS 4-port cables. in-memory cached data after power loss. The company decided not to sell the Advanced Data Protection package (support for RAID 6 and additional functions) as an optional update. But backup via snapshots (snapshot backup) will be available only after purchasing a registration key. The RAID controller comes with a three-year warranty.
At the time of publication, the Adaptec RAID 3805 was priced at $ 600.


Click on the picture to enlarge.

Atto launches two PCI Express RAID 5 SAS / SATA controllers: R380, with two external ports, four drives each, and R348, with one port for four external storage(SFF 8088) and two ports to support up to eight internal hard drives (SFF 8087). However, you can use a maximum of eight ports, including internal and external. According to the Atto website, this feature is unique. We decided to test the R348 as it is more flexible than the R380.
Disadvantages first: this controller does not support RAID 6, and it does not have as broad OS support as the Adaptec models. It also comes with a two-year warranty, although Adaptec, ICP, and Ciprico / Raidcore provide three years. We were also informed that the default controller settings may not provide optimal performance, but unfortunately after we have completed the tests. A feature called "RGSSpeedRead" allows read-ahead reads from RAID arrays, but must be enabled through the command interface. We found a short description of this feature on the last pages of the manual. We didn't have time to repeat all the tests, but after turning on "RGSSpeedRead" the reading speed really increases. It's a shame that Atto didn't include this feature at the factory. Or she didn't devote a separate chapter to the performance optimization instructions. R348 has a Java interface that is easy to use but doesn't provide many options. We also don't understand why users must register with Atto before downloading anything.
Like other controllers, the Express SAS R348 is a low-profile PCI Express card that uses eight PCIe lanes. But unlike Adaptec and ICP cards, it is equipped with 256MB of DDR2 memory with ECC support. In addition, a more powerful XScale IOP 348 processor at 800 MHz is used. It delivered good, though not great, I / O benchmarks.
In terms of features, the Atto RAID controller supports all major RAID modes: 0, 1, 10, 5, 50. It can operate in JBOD mode and even RAID 4, which stores all redundancy information on a single hard drive. But unlike RAID 3, RAID 4 creates larger stripe blocks rather than single-byte blocks like RAID 3, which gives RAID 4 a performance boost over RAID 3. RAID levels 6 and 60 are not yet supported, but Atto promises that they will be added soon. The same goes for the optional battery, which is not yet available. OS supported Windows Server 2003, Windows 2000, Windows XP and Windows Vista, Max OS X 10.4, and three different Linux distributions, but Solaris, FreeBSD and Netware are excluded from the list.

Click on the picture to enlarge.
Click on the picture to enlarge.


Firmware version: 5.2.0 Build 12415.
This product is technically identical to the Adaptec RAID 3805, mainly because ICP Vortex is part of the Adaptec group of companies. The sample we received did not support RAID 6 and the "copyback" function, which was due to the outdated firmware. The update added support for RAID 6 and "copyback spare". However, there is a serious difference between Adaptec RAID 3805 and ICP 5085BL: ICP uses a faster processor IOP333 at 800 MHz, while Adaptec RAID 3805 operates at 500 MHz. ICP uses 256MB of DDR2 ECC cache, while Adaptec is limited to 128MB. As a result, we get better performance in RAID 5 benchmarks. The feature set, software, and package contents are identical to the Adaptec controller.

Click on the picture to enlarge.
 |
Click on the picture to enlarge.


Firmware version: 3.0.0.
Our first introduction to Raidcore controllers took place back in 2003 and it turned out to be quite impressive: the host controller uses an architecture called Fulcrum, which allows you to create powerful RAID controllers that are independent of the hardware level. As a result, Raidcore was one of the first companies to offer support solutions distribution of RAID arrays across multiple controllers... This became possible thanks to special logic that runs on the host machine. But there is also a drawback - all calculations of redundancy information must be performed by the central processors of the host-system, although today, with the advent of dual- and quad-core processors, this is no longer such an acute problem.
Raidcore's modern solutions are promoted by a company called Ciprico. There are four different models in the RC5000 line: two low-profile cards with four and eight ports, and two cards with full height for 12 and 16 ports. The number "8" just denotes the presence of eight ports, the 5100 models use the PCI-X interface, and the 5200 - PCI Express x1 or x4. Ciprico is the only vendor to provide controller spanning, allowing you to create large RAID arrays across multiple (or even different) Raidcore controllers. The list of functions is more complete than that of Adaptec / ICP or Atto, including disk roaming (transfer of hard drives to any port of any controller), flexible arrangement of disks for replacement / spare (dedicated / global / distributed), mirror splitting, array hiding (array hiding) etc.
Raidcore does not yet support RAID 6 or RAID 60 dual redundant arrays, but it does support RAID 0, 1, 10, JBOD, 5, 50, 1n, and 10n. Drivers are available for all common versions of Windows, Red Hat, Suse and Fedora Linux. Novell Netware, Sun Solaris, and other operating systems are not supported. Ciprico comes with a three-year warranty, and the control software is logical and powerful. The performance of the RC5252-8 is good, although it depends a lot on the host system. In our case, a single dual-core Xeon processor (Nocona core) at 3.6 GHz turned out to be a good choice. However, any dual-core Xeon 5200 (Woodcrest or Clovertown) will give even better performance.


Click on the picture to enlarge.
| Manufacturer | Adaptec | Atto | ICP | Raidcore |
| Model | RAID 3805 | ExpressSAS R348 | RC5252-8 | |
| Internal connectors | 2x SFF 8087 | 2x SFF 8087 | 2x SFF 8087 | 2x SFF 8087 |
| External connectors | N / A | 1x SFF 8088 | N / A | N / A |
| Total SAS Ports | 8 | 8 | 8 | 8 |
| Cache memory | 128 MB DDR2 ECC | 256 MB DDR2 ECC | 256 MB DDR2 ECC | No |
| Interface | PCI Express x4 | PCI Express x8 | PCI Express x4 | PCI Express x4 |
| XOR engine | Intel 80333 500 MHz | IOP 348 800 MHz | Intel 80333 800 MHz | Program |
| Migrating RAID Levels | Yes | Yes | Yes | |
| Online capacity expansion | Yes | Yes | Yes | Yes |
| Multiple RAID Arrays | Yes | Yes | Yes | Yes |
| Delayed spindle unwind | Yes | Yes | Yes | |
| Flexible support for spare / spare hard drive | Yes | Yes | Yes | Yes |
| Automatic Failover | Yes | Yes | ||
| Battery for backup power | Optional | Optional | Optional | Not needed, no cache |
| Fan | No | No | No | No |
| OS support | Novell NetWare 6.5 SCO OpenServer UnixWare Sun Solaris 10 x86 FreeBSD |
Windows Vista, Server 2003, XP, 2000 Mac OS X (10.4.x) Linux (Fedora, Red Hat and SuSE) |
Windows 2000, XP, Server 2003, Vista Red Hat Enterprise Linux (RHEL) SUSE Linux Enterprise Server (SLES) Novell NetWare 6.5 SCO OpenServerUnixWare Sun Solaris 10 x86 FreeBSD |
Windows 2000, XP, Server 2003, Vista Red Hat Enterprise Linux (RHEL) 4.5 SuSE 9.3, 10.1, 10.2 SUSE Linux Enterprise Server (SLES) Fedora Core 5.6 |
| Other | Copyback | DVRAID | Copyback | Controller Spanning |
| Guarantee | 3 years | 2 years | 3 years | 3 years |
| Recommended retail price | $575 | $1 095 | $650 |
| System hardware | |
| Processors | 2x Intel Xeon (Nocona core), 3.6 GHz, FSB800, 1 MB L2 cache |
| Platform | Asus NCL-DS (Socket 604), Intel E7520 chipset, BIOS 1005 |
| Memory | Corsair CM72DD512AR-400 (DDR2-400 ECC, reg.), 2x 512 MB, CL3-3-3-10 latency |
| System hard drive | Western Digital Caviar WD1200JB, 120 GB, 7,200 rpm, 8 MB cache, UltraATA / 100 |
| Storage controllers | Intel 82801EB UltraATA / 100 (ICH5) Promise SATA 300TX4 Promise FastTrak TX4310 Driver 2.06.1.310 |
| Network | Broadcom BCM5721 embedded 1Gbps |
| Video card | Integrated ATI RageXL, 8 MB |
| Tests | |
| Performance tests | Atto Diskmark |
| I / O performance | IOMeter 2003.05.10 Fileserver Benchmark Webserver Benchmark Database benchmark Workstation Benchmark |
| System software and drivers | |
| OS | Microsoft Windows Server 2003 Enterprise Edition, Service Pack 1 |
| Platform driver | Intel Chipset Installation Utility 7.0.0.1025 |
| Graphics driver | Windows default graphics driver |

Test results
RAID Initialization Time
We used eight Seagate Savvio 10K.2 hard drives and determined the time it took controllers to create RAID 5 or RAID 6 arrays.
| Controller | RAID 5 | RAID 6 |
| 1 hour 12 minutes | 1 hour 2 minutes | |
| Atto | 23 minutes | N / A |
| 57 minutes | 57 minutes | |
| 2 hours 42 minutes |
It is quite understandable that the controllers with the fastest XOR processors turned out to be the fastest. However, all controllers support background initialization, which slows down performance but allows the array to be used immediately.


Reduced RAID 6 Bandwidth


All four controllers are powerful, delivering high storage performance and rich features to create flexible, high-performance arrays for mid-range and entry level... All controllers have eight SAS ports, but SATA hard drives can also be connected to them, including mixed SAS / SATA options. With SAS extenders (expander) you can connect large quantity hard drives. We believe that the four controllers reviewed are suitable for connecting up to 12 hard drives, since most models are aimed at internal hard drives. If you want to connect external accessories, then pay attention to models with external Mini-SAS ports.
The ICP 5085BL controller is very close to the Adaptec RAID 3805, but offers better performance with a faster XOR processor and twice the cache size. However, the price is slightly higher: the recommended $ 650 instead of $ 575 for the Adaptec RAID 3805. Both cards offer an impressive feature set and come with a full set of software, which has improved a lot in recent years. Let's not forget that Adaptec is one of the most established players in the professional storage market. Atto charges $ 1,095 for its controller, and for that price you get fewer RAID features (excluding RAID 4 support), and you still need to do additional customization controller to make it run faster. It's okay, but with the default settings, the function that accelerates reading performance is turned off. The controller performs well with a downgraded RAID 5 array because write performance does not degrade like other products.
Raidcore delivers the most functional software, which is the result of a different architecture: it is tied to the host machine and depends on its performance. Unfortunately, Raidcore does not yet support RAID 6 (in fact, neither does Atto), but you can strip RAID arrays across multiple Raidcore controllers, and the I / O performance on our dual-socket Xeon server was excellent. Data rates were also high, but other controllers usually bypass Raidcore in this discipline.
If you do not mind the controller loading the host server with XOR calculations and the list of supported operating systems suits you, then the Ciprico / Raidcore model will provide an excellent price / quality ratio. However, Adaptec offers better performance in many areas, and the $ 575 price tag is also quite reasonable.
Briefly about modern RAID controllers
Currently RAID controllers are both separate solution focused exclusively on the specialized server segment of the market. Indeed, all modern motherboards for user PCs (not server boards) have integrated firmware SATA RAID controllers, which are more than enough for PC users. However, it must be borne in mind that these controllers are focused exclusively on the use of the Windows operating system. In operating systems of the Linux family, RAID arrays are created programmatically, and all calculations are transferred from the RAID controller to the central processor.
Servers traditionally use either hardware-software or purely hardware RAID controllers. A hardware RAID controller allows you to create and maintain a RAID array without the need for an operating system or CPU. Such RAID arrays are seen by the operating system as a single disk (SCSI disk). In this case, no specialized driver is needed - the standard (included in the operating system) SCSI disk driver is used. In this regard, hardware controllers are platform independent, and the RAID array is configured through the controller BIOS. A hardware RAID controller does not involve the central processor when calculating all checksums, etc., since it uses its own specialized processor and RAM for calculations.
Software and hardware controllers require a dedicated driver, which replaces the standard SCSI disk driver. In addition, software and hardware controllers are equipped with management utilities. In this regard, software and hardware controllers are tied to a specific operating system. All necessary calculations in this case are also performed by the processor of the RAID controller itself, but using driver software and the management utility allows you to control the controller through the operating system, not just through the controller BIOS.
Considering the fact that SAS drives have already replaced SCSI server drives, all modern server RAID controllers are focused on supporting either SAS or SATA drives, which are also used in servers.
Last year, drives with the new SATA 3 (SATA 6 Gb / s) interface began to appear on the market, which gradually began to replace the SATA 2 (SATA 3Gb / s) interface. SAS (3 Gb / s) drives have been replaced by SAS 2.0 (6 Gb / s) drives. Naturally, the new SAS 2.0 standard is fully compatible with the old standard.
Accordingly, RAID controllers with support for the SAS 2.0 standard appeared. It would seem, what's the point of switching to the SAS 2.0 standard, if even the fastest SAS disks have a read and write speed of no more than 200 MB / s and the SAS protocol bandwidth (3 Gb / s or 300 MB / s) is sufficient for them. ?
Indeed, when each drive is connected to a separate port on the RAID controller, 3 Gb / s bandwidth (which is 300 MB / s in theory) is sufficient. However, not only separate disks, but also disk arrays (disk baskets) can be connected to each port of the RAID controller. In this case, one SAS channel is shared by several drives at once, and the bandwidth of 3 Gb / s will no longer be enough. Well, in addition, you need to take into account the presence of SSD-drives, the read and write speed of which has already exceeded the bar of 300 MB / s. For example, the new Intel SSD 510 drive offers sequential read speeds of up to 500 MB / s and sequential write speeds of up to 315 MB / s.
After taking a quick look at the current situation in the server RAID controller market, let's take a look at the characteristics of the LSI 3ware SAS 9750-8i controller.
3ware SAS 9750-8i RAID Controller Specifications
This RAID controller is based on a specialized XOR processor LSI SAS2108 with a clock frequency of 800 MHz and PowerPC architecture. This processor uses 512MB of DDRII 800 MHz Error Correcting (ECC) memory.
The LSI 3ware SAS 9750-8i controller is compatible with SATA and SAS drives (both HDD and SSD drives are supported) and allows you to connect up to 96 devices using SAS expanders. It is also important that this controller supports drives with SATA 600 MB / s (SATA III) and SAS 2 interface.
For connecting drives, the controller provides eight ports, which are physically combined into two Mini-SAS SFF-8087 connectors (four ports in each connector). That is, if disks are connected directly to the ports, then a total of eight disks can be connected to the controller, and when disk cages are connected to each port, the total disk capacity can be increased to 96. Each of the eight controller ports has a bandwidth of 6 Gb / s, which corresponds to SAS 2 and SATA III standards.
Naturally, when connecting disks or disk cages to this controller, you will need specialized cables that have an internal Mini-SAS SFF-8087 connector at one end, and a connector at the other end that depends on what exactly is connected to the controller. For example, when connecting SAS disks directly to the controller, you must use a cable that has a Mini-SAS SFF-8087 connector on one side and four SFF 8484 connectors on the other, which allow you to directly connect SAS disks. Note that the cables themselves are not included in the package and must be purchased separately.
The LSI 3ware SAS 9750-8i controller has a PCI Express 2.0 x8 interface that provides 64 Gbps of bandwidth (32 Gbps in each direction). It is clear that this bandwidth is enough for a fully loaded eight SAS ports with a bandwidth of 6 Gb / s each. Also note that the controller has a special connector into which you can optionally connect the LSIiBBU07 backup battery.

It is important that this controller requires the installation of a driver, that is, it is a hardware-software RAID controller. It supports such operating systems as Windows Vista, Windows Server 2008, Windows Server 2003 x64, Windows 7, Windows 2003 Server, MAC OS X, LinuxFedora Core 11, Red Hat Enterprise Linux 5.4, OpenSuSE 11.1, SuSE Linux Enterprise Server (SLES ) 11, OpenSolaris 2009.06, VMware ESX / ESXi 4.0 / 4.0 update-1 and other Linux systems. The package also includes 3ware Disk Manager 2 software, which allows you to manage your RAID arrays through the operating system.
The LSI 3ware SAS 9750-8i controller supports standard RAID types: RAID 0, 1, 5, 6, 10, and 50. Perhaps the only array type that is not supported is RAID 60. This is due to the fact that this controller is capable of create a RAID 6 array on only five disks connected directly to each controller port (in theory, RAID 6 can be created on four disks). Accordingly, for a RAID 60 array, this controller requires at least ten disks, which simply do not exist.

It is clear that support for a RAID 1 array is irrelevant for such a controller, since given type the array is created on only two disks, and using such a controller for only two disks is illogical and extremely wasteful. But support for arrays RAID 0, 5, 6, 10 and 50 is very relevant. Although, perhaps, we were in a hurry with the RAID 0 array. Still, this array does not have redundancy, and, accordingly, does not provide reliable data storage, therefore it is rarely used in servers. However, in theory, this array is the fastest in terms of data read and write speed. However, let's remember how the different types of RAID arrays differ from each other and what they are.
RAID levels
The term "RAID array" appeared in 1987 when American researchers Patterson, Gibson and Katz from the University of California at Berkeley described in their article "A case for redundant arrays of inexpensive discs, RAID" how In this way, multiple low-cost hard drives can be combined into a single logical device so that the result is increased system capacity and performance, and the failure of individual drives does not lead to failure of the entire system. Almost 25 years have passed since the publication of this article, but the technology of building RAID arrays has not lost its relevance today. The only thing that has changed since then is the decoding of the RAID acronym. The fact is that initially RAID arrays were not built on cheap disks, so the word Inexpensive was changed to Independent, which was more in line with reality.
Fault tolerance in RAID arrays is achieved through redundancy, that is, part of the disk space is allocated for service purposes, becoming inaccessible to the user.
The increase in the performance of the disk subsystem is provided by the simultaneous operation of several disks, and in this sense, the more disks in the array (up to a certain limit), the better.
Disk sharing in an array can be done using either parallel or independent access. With parallel access, disk space is divided into blocks (strips) for data recording. Similarly, information to be written to disk is divided into the same blocks. When writing, individual blocks are written to different disks, and several blocks are written to various discs occurs concurrently, resulting in better write performance. Necessary information it is also read in separate blocks from multiple disks at the same time, which also increases performance in proportion to the number of disks in the array.
It should be noted that the parallel access model is implemented only if the size of the data write request is larger than the size of the block itself. Otherwise, it is almost impossible to write multiple blocks in parallel. Imagine a situation where the size of an individual block is 8KB, and the size of a data write request is 64KB. In this case, the original information is cut into eight blocks of 8 KB each. If you have a four-disk array, you can write four blocks, or 32 KB, at a time. Obviously, in the considered example, the write speed and read speed will be four times higher than when using a single disc. This is true only for an ideal situation, but the request size is not always a multiple of the block size and the number of disks in the array.
If the size of the data being written is less than the block size, then a fundamentally different model is implemented - independent access. Moreover, this model can also be used when the size of the recorded data is greater than the size of one block. With independent access, all data from a single request is written to a separate disk, that is, the situation is identical to working with one disk. The advantage of the independent access model is that if multiple write (read) requests are received at the same time, they will all be executed on separate disks independently of each other. This situation is typical, for example, for servers.
According to different types of access, there are different types of RAID arrays, which are usually characterized by RAID levels. In addition to the type of access, RAID levels differ in the way they are located and redundant information is generated. Redundant information can either be placed on a dedicated disk or shared across all disks.
Currently, there are several RAID levels that are widely used are RAID 0, RAID 1, RAID 5, RAID 6, RAID 10, RAID 50 and RAID 60. Previously, there were also RAID 2, RAID 3 and RAID 4 levels, however these RAID levels are not currently used and modern RAID controllers do not support them. Note that all modern RAID controllers also support the JBOD (Just a Bench Of Disks) function. In this case, we are not talking about a RAID array, but simply about connecting individual disks to a RAID controller.
RAID 0
RAID 0, or striping, is not, strictly speaking, a RAID array, since such an array is not redundant and does not provide data storage reliability. However, historically it is also called a RAID array. A RAID 0 array (Fig. 1) can be built on two or more disks and is used when it is necessary to provide high performance of the disk subsystem, and the reliability of data storage is not critical. When creating a RAID 0 array, information is split into blocks (these blocks are called stripes), which are simultaneously written to separate disks, that is, a system with parallel access is created (if, of course, the block size allows). By allowing simultaneous I / O from multiple disks, RAID 0 provides the fastest data transfer rate and maximum disk space utilization since it does not require storage space for checksums. The implementation of this level is very simple. RAID 0 is mainly used in areas where fast transfer of large amounts of data is required.

Rice. 1. RAID 0 array
In theory, the increase in read and write speed should be a multiple of the number of disks in the array.
The reliability of a RAID 0 array is obviously lower than the reliability of any of the disks individually and decreases with an increase in the number of disks included in the array, since the failure of any of them leads to the inoperability of the entire array. If the MTTF of each disk is MTTF disk, then the MTBF of a RAID 0 array consisting of n disks is equal to:
MTTF RAID0 = MTTD disk / n.
If we designate the probability of failure over a certain period of time of one disk after p, then for a RAID 0 array from n disks, the probability that at least one disk fails (the probability of an array falling) is:
P (array fall) = 1 - (1 - p) n.
For example, if the probability of a single disk failure within three years of operation is 5%, then the probability of a RAID 0 array falling from two disks is already 9.75%, and from eight disks - 33.7%.
RAID 1
A RAID 1 array (Figure 2), also referred to as a mirror, is a 100 percent redundant array of two drives. That is, the data is completely duplicated (mirrored), due to which a very high level of reliability (as well as cost) is achieved. Note that RAID 1 does not require pre-partitioning of disks and data into blocks. In the simplest case, two drives contain the same information and are one logical drive. If one disk fails, its functions are performed by another (which is absolutely transparent to the user). Restoring the array is done by simple copying. In addition, in theory, a RAID 1 array should double the read speed, since this operation can be performed simultaneously from two disks. This information storage scheme is used mainly in cases where the cost of data security is much higher than the cost of implementing the storage system.
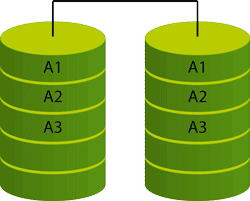
Rice. 2. RAID 1 array
If, as in the previous case, we denote the probability of failure for a certain period of time of one disk after p, then for a RAID 1 array, the probability that both disks will fail at the same time (the probability of the array falling) is:
P (falling array) = p 2.
For example, if the probability of failure of one disk within three years of operation is 5%, then the probability of simultaneous failure of two disks is already 0.25%.
RAID 5
A RAID 5 array (Figure 3) is a fault-tolerant disk array with distributed checksum storage. When writing, the data stream is divided into blocks (stripes) at the byte level, which are simultaneously written to all disks in the array in a circular order.

Rice. 3. RAID 5 array
Suppose the array contains n disks, and the stripe size is d... For each portion of n-1 stripes checksum is calculated p.
Stripe d 1 written to the first disk, stripe d 2- on the second and so on up to the stripe d n–1, which is written to the (n – 1) th disc. Next, a checksum is written to the n-th disk p n, and the process is cyclically repeated from the first disk on which the stripe is written d n.
The recording process ( n–1) stripes and their checksum are performed simultaneously for all n disks.
The checksum is calculated using a bitwise exclusive OR (XOR) operation on the data blocks being written. So, if there is n hard drives and d- data block (stripe), the checksum is calculated using the following formula:
p n = d 1⊕ d 2 ⊕ ... ⊕ d n – 1.
If any disk fails, the data on it can be recovered from the control data and from the data remaining on the healthy disks. Indeed, using the identities (a⊕ b) A b= a and a⊕ a = 0 , we get that:
p n⊕ (d k⊕ p n) = d l⊕ d n⊕ ...⊕ ...⊕ d n – l⊕ (d k⊕ p n).
d k = d 1⊕ d n⊕ ...⊕ d k – 1⊕ d k + 1⊕ ...⊕ p n.
Thus, if a disk with a block fails d k, then it can be restored by the value of the remaining blocks and the checksum.
In the case of RAID 5, all drives in the array must have the same size, however, the total capacity of the disk subsystem available for recording becomes less by exactly one disk. For example, if five disks are 100 GB, then the actual size of the array is 400 GB because 100 GB is reserved for audit information.
A RAID 5 array can be built on three or more hard drives... As the number of hard drives in an array increases, its redundancy decreases. Note also that a RAID 5 array can be recovered if only one drive fails. If two drives fail at the same time (or if a second drive fails while rebuilding the array), then the array cannot be recovered.
RAID 6
A RAID 5 array has been shown to be rebuildable if one disk fails. However, sometimes you need to provide a higher level of reliability than a RAID 5 array. In this case, you can use a RAID 6 array (Figure 4), which allows you to restore the array even if two drives fail at the same time.

Rice. 4. RAID 6 array
A RAID 6 array is similar to RAID 5, but it uses not one, but two checksums that are cyclically distributed across the disks. First checksum p is calculated using the same algorithm as in a RAID 5 array, that is, it is an XOR operation between data blocks written to different disks:
p n = d 1⊕ d2⊕ ...⊕ d n – 1.
The second checksum is calculated using a different algorithm. Without going into mathematical details, let's say that this is also an XOR operation between blocks of data, but each block of data is pre-multiplied by a polynomial coefficient:
q n = g 1 d 1⊕ g 2 d 2⊕ ...⊕ g n – 1 d n – 1.
Accordingly, the capacity of two disks in the array is allocated for checksums. In theory, a RAID 6 array can be created on four or more drives, but in many controllers it can be created on a minimum of five drives.
It should be borne in mind that the performance of a RAID 6 array, as a rule, is 10-15% lower than the performance of a RAID 5 array (with an equal number of disks), which is caused by the large amount of calculations performed by the controller (it is necessary to calculate the second checksum, as well as read and overwrite more disk blocks as each block is written).
RAID 10
RAID 10 (Figure 5) is a mix of levels 0 and 1. A minimum of four drives are required for this level. In a RAID 10 array of four disks, they are paired together into RAID 1 arrays, and both of these arrays are as logical drives are combined into a RAID 0 array. Another approach is also possible: initially, the disks are combined into RAID 0 arrays, and then the logical drives based on these arrays are combined into a RAID 1 array.

Rice. 5. RAID 10 array
RAID 50
RAID 50 is a mix of levels 0 and 5 (Figure 6). The minimum required for this level is six disks. In a RAID 50 array, two RAID 5 arrays are first created (at least three disks in each), which are then combined as logical disks into a RAID 0 array.
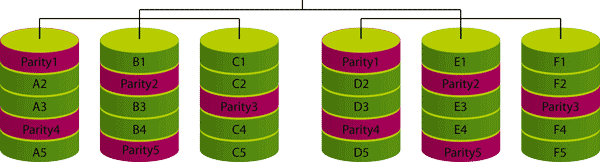
Rice. 6. RAID 50 array
LSI 3ware SAS 9750-8i Controller Test Methodology
To test the LSI 3ware SAS 9750-8i RAID controller, we used the specialized test suite IOmeter 1.1.0 (version 2010.12.02). Test stand had the following configuration:
- processor - Intel Core i7-990 (Gulftown);
- motherboard - GIGABYTE GA-EX58-UD4;
- memory - DDR3-1066 (3 GB, three-channel operation mode);
- system disk- WD Caviar SE16 WD3200AAKS;
- video card - GIGABYTE GeForce GTX480 SOC;
- RAID controller - LSI 3ware SAS 9750-8i;
- The SAS drives attached to the RAID controller are Seagate Cheetah 15K.7 ST3300657SS.
Testing conducted under operating room control Microsoft systems Windows 7 Ultimate (32-bit).
We used the Windows RAID controller driver version 5.12.00.007 and also updated the controller firmware to version 5.12.00.007.
The system disk was connected to SATA, implemented through a controller integrated into the south bridge of the Intel X58 chipset, and SAS disks were connected directly to the ports of the RAID controller using two Mini-SAS SFF-8087 -> 4 SAS cables.
The RAID controller was installed in a PCI Express x8 slot on the motherboard.
The controller was tested with the following RAID arrays: RAID 0, RAID 1, RAID 5, RAID 6, RAID 10 and RAID 50. The number of disks combined in a RAID array varied for each type of array from a minimum value to eight.
The stripe size on all RAID arrays did not change and was 256 KB.
Recall that the IOmeter package allows you to work both with disks on which a logical partition is created, and with disks without a logical partition. If a disk is tested without a logical partition created on it, then IOmeter works at the level of logical data blocks, that is, instead of the operating system, it sends commands to the controller to write or read LBA blocks.
If a logical partition is created on the disk, then initially the IOmeter utility creates a file on the disk that occupies the entire logical partition by default (in principle, the size of this file can be changed by specifying it in the number of 512 byte sectors), and then it already works with this file, that is, it reads or writes (overwrites) individual LBAs within this file. But again, IOmeter works bypassing the operating system, that is, it directly sends requests to the controller to read / write data.
In general, when testing HDD disks, as practice shows, there is practically no difference between the test results of a disk with a created logical partition and without it. At the same time, we believe that it is more correct to conduct testing without a created logical partition, since in this case the test results do not depend on the used file system(NTFA, FAT, ext, etc.). This is why we performed testing without creating logical partitions.
In addition, the IOmeter utility allows you to set the Transfer Request Size for writing / reading data, and the test can be performed both for sequential (Sequential) reads and writes, when LBA blocks are read and written sequentially one after another, and for random (Random), when LBA-blocks are read and written in random order. When generating a load scenario, you can set the test time, the percentage ratio between sequential and random operations (Percent Random / Sequential Distribution), as well as the percentage ratio between read and write operations (Percent Read / Write Distribution). In addition, the IOmeter utility automates the entire testing process and saves all results to a CSV file, which can then be easily exported to an Excel spreadsheet.
Another setting that the IOmeter utility allows you to do is the so-called Align I / Os on boundaries. sectors of hard disk. By default, IOmeter aligns request blocks to 512-byte disk sector boundaries, but arbitrary alignment can also be specified. Actually, most hard drives have a sector size of 512 bytes, and only recently have drives with a sector size of 4 Kbytes begun to appear. Recall that in HDDs, a sector is the smallest addressable data size that can be written to or read from the disk.
When conducting testing, it is necessary to set the alignment of the blocks of data transfer requests by the size of the disk sector. Since Seagate Cheetah 15K.7 ST3300657SS drives have a sector size of 512 bytes, we used 512-byte sector alignment.
Using the IOmeter test suite, we measured the sequential read and write speed, as well as the random read and write speed of the created RAID array. The sizes of the transmitted data blocks were 512 bytes, 1, 2, 4, 8, 16, 32, 64, 128, 256, 512 and 1024 KB.
In the listed load scenarios, the test time with each request to transfer a data block was 5 minutes. Also note that in all the tests listed, we set the depth of the task queue (# of Outstanding I / Os) to 4 in the IOmeter settings, which is typical for user applications.
Test results
After reviewing the benchmark results, we were surprised by the performance of the LSI 3ware SAS 9750-8i RAID controller. And so much so that they began to look through our scripts to identify errors in them, and then repeated the testing many times with other settings of the RAID controller. We changed the stripe size and cache mode of the RAID controller. This, of course, affected the results, but did not change the general nature of the dependence of the data transfer rate on the size of the data block. And we just could not explain this dependence. The work of this controller seems to us completely illogical. First, the results are unstable, that is, for each fixed size of the data block, the speed changes periodically and the average result has a large error. Note that usually the results of testing disks and controllers using the IOmeter utility are stable and differ only slightly.
Second, as the block size increases, the data rate must increase or remain unchanged in saturation mode (when the rate reaches its maximum value). However, with the LSI 3ware SAS 9750-8i controller, there is a sharp drop in data rate at some block sizes. In addition, it remains a mystery to us why, with the same number of disks for RAID 5 and RAID 6 arrays, the write speed is higher than the read speed. In short, we cannot explain the operation of the LSI 3ware SAS 9750-8i controller - all that remains is to state the facts.
Test results can be classified in different ways. For example, for boot scenarios, when, for each type of boot, results are given for all possible RAID arrays with a different number of connected disks, or for types of RAID arrays, when results with a different number of disks are indicated for each type of RAID array in sequential read scenarios. , sequential write, random read, and random write. You can also classify the results by the number of disks in the array, when for each number of disks connected to the controller, the results are given for all possible (given the number of disks) RAID arrays in sequential read and sequential write, random read, and random write scenarios.
We decided to classify the results by the types of arrays, since, in our opinion, despite the rather large number of graphs, such their presentation is more visual.
RAID 0
A RAID 0 array can be created with two to eight drives. The test results for a RAID 0 array are shown in Fig. 7-15.
|
|
Rice. 7. Speed of sequential read and write |
Rice. 8. Speed of sequential read and write |
|
|
Rice. 9. Sequential read speed |
Rice. 10. Speed of sequential read and write |
|
|
Rice. 11. Speed of sequential read and write |
Rice. 12. Speed of sequential read and write |
|
|
Rice. 13. Speed of sequential read and write |
Rice. 14. Random read speed |
|
|
Rice. 15. The speed of random write in a RAID 0 array |
|


It is clear that the fastest sequential read and write speeds in a RAID 0 array are achieved with eight disks. It is worth noting that with eight and seven disks in a RAID 0 array, the sequential read and write speeds are practically the same, and with fewer disks, the sequential write speed becomes faster than the read speed.
It should also be noted that there are characteristic failures in sequential read and write speed for certain block sizes. For example, with eight and six disks in the array, such failures are observed at a data block size of 1 and 64 KB, and with seven disks - at a size of 1, 2, and 128 KB. There are similar failures, but with other sizes of data blocks, there are also four, three, and two disks in the array.
In terms of sequential read and write speed (as a characteristic averaged over all block sizes), RAID 0 outperforms all other possible arrays in a configuration with eight, seven, six, five, four, three, and two drives.
Random access in a RAID 0 array is also pretty interesting. The random read speed for each data block size is proportional to the number of disks in the array, which is quite logical. Moreover, with a block size of 512 KB, with any number of disks in the array, there is a characteristic drop in the random read speed.
In case of random writing with any number of disks in the array, the speed increases with the increase in the size of the data block and there are no drops in speed. At the same time, it should be noted that the highest speed in this case is achieved not with eight, but with seven disks in the array. Next in terms of random write speed is an array of six disks, then five, and only then eight disks. Moreover, in terms of random write speed, an array of eight disks is almost identical to an array of four disks.
In terms of random write speed, RAID 0 outperforms all other possible arrays in configurations with eight, seven, six, five, four, three and two drives. On the other hand, in terms of random read speed in a configuration with eight disks, RAID 0 is inferior to RAID 10 and RAID 50, but in a configuration with fewer disks, RAID 0 is the leader in random read speed.
RAID 5
A RAID 5 array can be created with three to eight drives. The test results for a RAID 5 array are shown in Fig. 16-23.
|
|
Rice. 16. Speed of sequential read and write |
Rice. 17. Speed of sequential read and write |
|
|
Rice. 18. Speed of sequential read and write |
Rice. 19. Speed of sequential read and write |
|
|
Rice. 20. Speed of sequential read and write |
Rice. 21. Speed of sequential read and write |
|
|
Rice. 22. Random read speed |
Rice. 23. Random write speed |


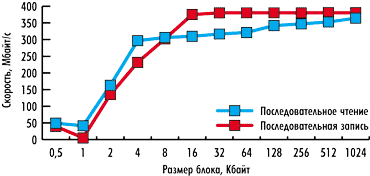


It is clear that the highest read and write speed is achieved with eight disks. Note that for a RAID 5 array, the sequential write speed is, on average, faster than the read speed. However, for a given request size, the sequential read speed can exceed the sequential write speed.
It should also be noted that there are typical failures in sequential read and write speed for certain block sizes for any number of disks in the array.
In sequential read and write speeds in a configuration with eight drives, RAID 5 is inferior to RAID 0 and RAID 50, but outperforms RAID 10 and RAID 6. In configurations with seven drives, RAID 5 is inferior in sequential read and write speed. RAID array 0 and outperforms RAID 6 (other types of arrays are not possible with the given number of disks).
In six-drive configurations, RAID 5 is outperforming RAID 0 and RAID 50 in sequential read speed, and only RAID 0 in sequential write speed.
In configurations with five, four and three drives, RAID 5 is second only to RAID 0 in sequential read and write speeds.
Random access in a RAID 5 array is similar to random access in a RAID 0. Thus, the random read speed for each data block size is proportional to the number of disks in the array, and with a 512 KB block size, for any number of disks in the array, there is a characteristic drop in random read speed. Moreover, it should be noted that the random read speed weakly depends on the number of disks in the array, that is, for any number of disks, it is approximately the same.
In terms of random read speed, RAID 5 in a configuration with eight, seven, six, four and three drives is inferior to all other arrays. And only in a configuration with five drives does it slightly outperform a RAID 6 array.
In terms of random write speed, RAID 5 in a configuration with eight disks is second only to RAID 0 and RAID 50, and in a configuration with seven and five, four and three disks, it is second only to RAID 0.
In a six-drive configuration, RAID 5 is inferior in random write speed to RAID 0, RAID 50, and RAID 10.
RAID 6
The LSI 3ware SAS 9750-8i controller allows you to create a RAID 6 array of five to eight drives. The test results for a RAID 6 array are shown in Fig. 24-29.
|
|
|
Rice. 24. Speed of sequential read and write |
Rice. 25. Speed of sequential read and write We also note the characteristic failures in sequential read and write speed for certain block sizes for any number of disks in the array. In terms of sequential read speed, RAID 6 is inferior to all other arrays in configurations with any (from eight to five) number of disks. In terms of sequential write speed, the situation is somewhat better. In a configuration with eight drives, RAID 6 outperforms RAID 10, and in a configuration with six drives, both RAID 10 and RAID 50. However, in configurations with seven and five drives, when creating RAID 10 and RAID 50 arrays is not possible, this array turns out to be in last place in terms of sequential write speed. Random access in a RAID 6 array is similar to random access in RAID 0 and RAID 5. Thus, the random read speed with a 512 KB block size for any number of disks in the array has a characteristic drop in random read speed. Note that the maximum random read speed is achieved with six disks in the array. But with seven and eight disks, the random read speed is almost the same. In case of random writing with any number of disks in the array, the speed increases with the increase in the size of the data block and there are no drops in speed. In addition, the random write speed is proportional to the number of disks in the array, but the difference in speed is insignificant. In terms of random read speed, RAID 6 in a configuration with eight and seven drives is ahead of only RAID 5 and is inferior to all other possible arrays. In a six-drive configuration, RAID 6 is inferior to RAID 10 and RAID 50 in random read speed, and in a five-drive configuration, it is inferior to RAID 0 and RAID 5. In terms of random write speed, a RAID 6 array is inferior to all other possible arrays with any number of connected drives. On the whole, we can state that the RAID 6 array is inferior in performance and the RAID 0, RAID 5, RAID 50 and RAID 10 arrays. That is, in terms of performance, this type of array is in last place. |
Rice. 33. Random read speed |
|
||
Rice. 34. Speed of random write in a RAID 10 array |
||
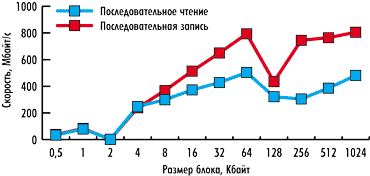


Typically, in arrays of eight and six disks, the sequential read speed is higher than the write speed, while in an array of four disks, these speeds are practically the same for any data block size.
For a RAID 10 array, as well as for all other considered arrays, a drop in sequential read and write speed is typical for certain sizes of data blocks for any number of disks in the array.
In case of random writing with any number of disks in the array, the speed increases with the increase in the size of the data block and there are no drops in speed. In addition, the random write speed is proportional to the number of disks in the array.
In terms of sequential read speed, the RAID 10 array follows RAID 0, RAID 50 and RAID 5 arrays in a configuration with eight, six and four disks, and in sequential write speed it is inferior even to a RAID 6 array, that is, it follows the RAID 0 arrays. RAID 50, RAID 5 and RAID 6.
On the other hand, in terms of random read speed, the RAID 10 array outperforms all other arrays in the configuration with eight, six and four disks. But in terms of random write speed, this array loses to RAID 0, RAID 50 and RAID 5 arrays in a configuration with eight disks, RAID 0 and RAID 50 arrays in a six-disk configuration, and RAID 0 and RAID 5 arrays in a four-disk configuration.
RAID 50
A RAID 50 array can be built on six or eight drives. The test results for a RAID 50 array are shown in Fig. 35-38.
In the random read scenario, as in all the other considered arrays, there is a characteristic drop in performance at a block size of 512 KB. In case of random writing with any number of disks in the array, the speed increases with the increase in the size of the data block and there are no drops in speed. In addition, the random write speed is proportional to the number of disks in the array, but the difference in speed is insignificant and is observed only with a large (more than 256 KB) data block size. In terms of sequential read speed, the RAID 50 array is second only to the RAID 0 array (in a configuration with eight and six drives). In terms of sequential write speed, RAID 50 is also second only to RAID 0 in a configuration with eight drives, and in a configuration with six drives, it loses to RAID 0, RAID 5, and RAID 6. On the other hand, in terms of random read and write speed, the RAID 50 array is second only to the RAID 0 array and is ahead of all other arrays with eight and six disks. RAID 1As we have already noted, a RAID 1 array, which can be built on only two disks, is inappropriate to use on such a controller. However, for the sake of completeness, we present the results for a RAID 1 array on two disks. The test results for a RAID 1 array are shown in Fig. 39 and 40.
Rice. 39. Speed of sequential writing and reading in a RAID 1 array
Rice. 40. Speed of random writing and reading in a RAID 1 array For a RAID 10 array, as well as for all other considered arrays, a drop in sequential read and write speed is typical for certain data block sizes. In the random read scenario, as well as for other arrays, there is a characteristic drop in performance with a block size of 512 KB. In case of random writing, the speed increases with the increase in the size of the data block and there are no speed dips. A RAID 1 array can only be mapped to a RAID 0 array (since no other arrays are possible with two disks). It should be noted that a RAID 1 array outperforms a RAID 0 array with two disks in all load scenarios except random read. conclusionsOur impression from testing the LSI 3ware SAS 9750-8i controller in combination with Seagate Cheetah 15K.7 ST3300657SS SAS drives was rather mixed. On the one hand, he has beautiful functionality, on the other hand, the speed drops are alarming at certain sizes of data blocks, which, of course, affects the speed performance of RAID arrays when they function in a real environment. |


 Cobra")


